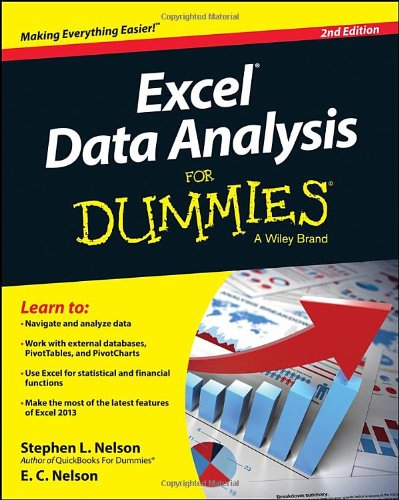
Excel Data Analysis For Dummies, 2nd Edition
- Length: 360 pages
- Edition: 2
- Language: English
- Publisher: For Dummies
- Publication Date: 2014-05-05
- ISBN-10: 1118898095
- ISBN-13: 9781118898093
- Sales Rank: #959965 (See Top 100 Books)
Harness the power of Excel to discover what your numbers are hiding
Excel Data Analysis For Dummies, 2nd Edition is the ultimate guide to getting the most out of your data. Veteran Dummies author Stephen L. Nelson guides you through the basic and not-so-basic features of Excel to help you discover the gems hidden in your rough data. From input, to analysis, to visualization, the book walks you through the steps that lead to superior data analysis.
Excel is the number-one spreadsheet application, with ever-expanding capabilities. If you’re only using it to balance the books, you’re missing out on a host of functions that can benefit your business or personal finances by uncovering trends and other important information hidden within the numbers. Excel Data Analysis For Dummies, 2nd Edition eliminates the need for advanced statistics or analysis courses by allowing you to harness the full power of Excel to do the heavy lifting for you. This 2nd Edition is fully updated to include information about Excel’s latest features, making it a your go-to Excel guide for data analysis. Topics include:
- Working with external databases
- PivotTables and PivotCharts
- Using Excel for statistical and financial functions
- Solver, Small Business Finance Manager, and more
The book also includes a guide to chart types and formatting, and advice on effective visual data presentation. You already have the data, so you might as well get something great out of it. Excel Data Analysis For Dummies, 2nd Edition is the key to discovering what your numbers are hiding.
Table of Contents
Part I: Where’s the Beef?
Chapter 1: Introducing Excel Tables
Chapter 2: Grabbing Data from External Sources
Chapter 3: Scrub-a-Dub-Dub: Cleaning Data
Part II: PivotTables and PivotCharts
Chapter 4: Working with PivotTables
Chapter 5: Building PivotTable Formulas
Chapter 6: Working with PivotCharts
Chapter 7: Customizing PivotCharts
Part III: Advanced Tools
Chapter 8: Using the Database Functions
Chapter 9: Using the Statistics Functions
Chapter 10: Descriptive Statistics
Chapter 11: Inferential Statistics
Chapter 12: Optimization Modeling with Solver
Part IV: The Part of Tens
Chapter 13: Ten Things You Ought to Know about Statistics
Chapter 14: Almost Ten Tips for Presenting Table Results and Analyzing Data
Chapter 15: Ten Tips for Visually Analyzing and Presenting Data
Appendix: Glossary of Data Analysis and Excel Terms

Microsoft 365 Copilot At Work: Using AI to Get the Most from Your Business Data and Favorite Apps


